INFORMATION SOURCE |
TYPE OF INFORMATION POTENTIALLY AVAILABLE |
Traders/Buyers |
|
Processing Companies |
|
Government Ministries/Departments Information services (Planning, Agriculture, Finance, Forestry, Natural Resources, Trade, Commerce, Bureau of Statistics, Marketing Services) |
|
Exporters |
|
International Organizations (Technical divisions - marketing, forestry, forest/agricultural products/industries/enterprises, community forestry, agroforestry) (production surveys, country studies) |
|
University Departments/Libraries |
|
Mass Media (Radio, television, newspapers) |
|
Retailers |
|
Marketing Boards, Marketing Administrations |
|
Cooperatives (production, processing, sale) |
|
Institutes for enterprise development |
|
Local Producers |
|
Casley, D. J. and Lury, D. A. 1981. Data Collection in Developing Countries. Clarendon Press, Oxford.
Chambers, R. , Pacey, A. and Thrupp, L. A. , eds. 1989. Farmer First. Intermediate Technology Publications, London.
* Davis-Case, D. 1990. The Community's Toolbox: The Idea, Methods and Tools for Participatory Assessment, Monitoring, and Evaluation in Community Forestry. Community Forestry Field Manual 2. FAO, Rome.
* Davis-Case, D. 1989. Community Forestry: Participatory Assessment, Monitoring, and Evaluation. Community Forestry Note 2. FAO, Rome.
* Forests, Trees and People Newsletter No. 15/16. 1992. Forests, Trees and People Programme. IRDC, Swedish University of Agricultural Sciences, Uppsala.
Freudenberger, K. S. 1994. Tree and Land Tenure: Rapid Appraisal Tools. Community Forestry Field Manual 4. FAO, Rome.
** Gueye. B. and Freudenberger, K. S. 1991. Introduction a la Méthode Accélerée de Recherche Participative (MARP):: Quelques Notes Pour Appuyer une Formation Pratique. IIED, London.
* Molnar, A. 1989. Community Forestry: Rapid Appraisal. Community Forestry Note 3. FAO, Rome.
P. A. C. T. 1989. Participatory Evaluation: A User's Guide. PACT, New York.
Schönhuth, M and Kievelitz, U. 1994. Participatory Learning Approaches: Rapid Rural Appraisal and Participatory Rural Appraisal. G. T. Z. , Rossdorf, Germany.
Thies. J. and Grady, H. 1991. Participatory Rapid Appraisal for Community Development. RED, London.
* Warner, K. 1995. Selecting Tree Species on the Basis of Community Needs. Community Forestry Field Manual 5. FAO, Rome.
Rapid Rural Appraisal (RRA) is a participatory research methodology that is especially useful for gathering information at the community level. Several tools of RRA are particularly well suited for gathering the kind of information needed in the assessment step of an MIS. Three of these tools will be briefly presented here. There are many other RRA tools, and readers are encouraged to consult the literature on RRA for more extensive information on the correct use of the methodology and its various information gathering techniques.
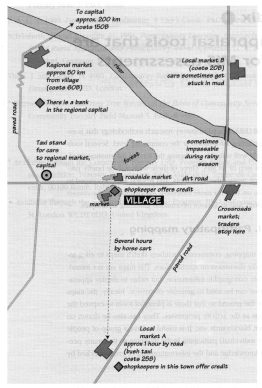
In participatory mapping, community members sketch maps to elicit information and provoke discussion on spatial issues. The maps are not intended to provide accurate cartographic information, but rather to display approximate information that can be used to generate discussion. Ideally, the maps should be drawn on the ground so that there is plenty of room to expand the scale of the drawings as the activity progresses. They can also be drawn on large sheets of paper, blackboards, etc. It is useful to have a group of people (rather than a single individual) participate in the mapping so that many people contribute their knowledge and the information can be cross-checked by several sources.
In gathering information for an MIS, it would be particularly useful to map where area markets are located and to use this to get information about transportation options, size of the market, etc.
Figure 6: Example of a participatory map

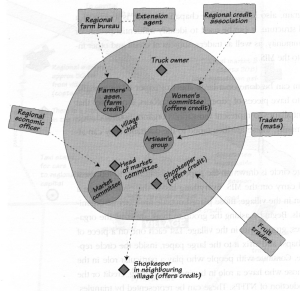
The Venn diagram, also known as the chapati diagram, is a map of a community's social structure. It can be used to identify influential people or committees in a community, as well as traders, sources of credit and other information relevant to the MIS.
A Venn diagram can be done on a large sheet of paper or on a chalk-board. It is helpful to have pieces of paper (different colours, if possible) that are cut into different shapes to represent the various organizations and individuals in the community. These are then taped to the diagram. They can also be drawn.
To begin, a large circle is drawn on the paper or chalkboard to represent the village that will carry out the MIS. Everything inside the circle will be a committee or person in the village; those placed outside are external organizations or individuals. Begin by asking the group to think about all the organizations, committees, groups, etc. in the village. List each one on a piece of paper (a circle, perhaps) and affix it to the large paper, inside the circle representing the village. Continue with people who play a particular role in the village, especially those who have a role in business, marketing, credit or the management or production of NTFPs. These can be represented by triangles.
When all the village organizations and individuals have been put on the diagram, continue by asking about organizations and individuals outside the village. This might include traders who come to the village, people who offer credit, government officials who regulate marketing, etc. Place a shape for each individual (triangle) or group (circle) cited on the diagram.
Once the diagram is completed, use it to discuss the roles of the various groups and individuals and the implications for the production and marketing of NTFPs in the community.
Figure 7: Example of a Venn diagram

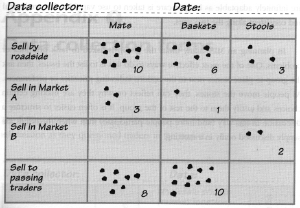
Matrices can be used to explore many issues of concern in the assessment. A matrix is a double entry grid for analysing two variables. It can be used, as in the example below, to determine where (put markets on the vertical axis) people are selling different products (put the products on the horizontal axis). The first step in this example would be for the group to list what NTFPs they sell and where they sell them so that these can be put on the horizontal and vertical axes.

Starting with mats, ask people to put stones in each of the boxes under mats to show whether they sell more mats at the roadside, at Market A or Market B, etc. Do the same thing for baskets and stools. Then use the diagram to provoke discussion about the advantages/disadvantages of different markets, why they favour one over another, what constraints they face in marketing, etc.
A matrix could also be used to rank the problems in marketing different goods. Once again, the goods could be placed on the horizontal axis. The group could then list the problems (e.g. cost of transport, breakage in transport, price offered too low to meet costs of production, stock does not sell quickly, product rots before it is sold) on the vertical axis. In this case, the number of stones would show how big a problem it is: more stones for a bigger problem, fewer for one that is less difficult. Such a matrix could be used to provoke discussion about how an MIS could be useful in overcoming some of the problems.
Another use of matrices in an evaluation is discussed in chapter 5. Matrices are infinitely adaptable as long as care is taken to use variables that are logical and consistent along the two axes.
In planning an MIS, many times the group is asked to rank priorities or problems. One of the most effective ways to do this is to list the issues, then ask the group to place stones next to the options indicating priorities or preferences. As people move the stones, they can reflect on why they are making certain choices and justify them to the rest of the group. It is often easier to structure a discussion in this way (and more people participate) than when the issues are simply discussed orally in a meeting.
The following form was used by data collectors in the Philippines to record information as they questioned traders in the market.
Data collector:____________________________ |
Date:______________________________ | ||||||
Whole price in (market location) |
| ||||||
Traders | |||||||
Type of product |
Unit of measure |
1. |
2. |
3. |
4. |
5. |
Comments |
1. Coconut piece |
piece |
||||||
2. Banana |
kilo |
||||||
3. Banana |
kilo |
||||||
4. Eggplant |
kilo |
||||||
5.Cassava kilo |
kilo |
||||||
6. Ginger kilo |
kilo |
||||||
7. Black pepper |
kilo |
||||||
8. Pineapple |
piece |
||||||
The following form was used by the price recorder in the Philippines to keep track of whether the data collectors had submitted their reports on time.
Data collector:___________________________ |
Date:______________________________ | ||||
Price collection activities record | |||||
Period |
Data collection |
Report submission |
Reason/s |
||
week |
done |
Not done |
On Time |
Late |
Comments |
The following form was used by the Mukono Women's Craft Group to record information on sales and consumer preferences.
Data collector:_______________________ |
Date:____________________________________ | |
Product | ||
Mat |
Stool |
Basket |
Size: |
Colour: |
Material: |
Which colours do you prefer? | ||
Which other products would you like to have available here? | ||
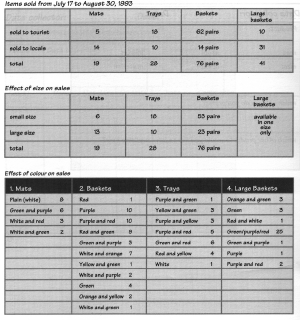
The following is an example of how information on the Uganda forms was summarized for sales of different items.

Three lists of questions were devised for the first Philippine Field Evaluation. The first was used to orient discussions with data collectors and recorders. The second was used in interviews with farmers who participated in using MIS information. The third was used for local government officials and project staff with knowledge of the MIS experience. Each interview opened with an introduction of the evaluation team and closed with an expression of appreciation for the interviewee's time.
A. INTERVIEW GUIDE FOR DATA COLLECTORS AND RECORDERS
Name:____________________ |
Assigned Market:_________________________ |
1. |
When did you Start collecting or recording data for the price information system? |
2. |
Did you volunteer to be a data collector or recorder? Why? |
3. |
Is the purpose of the activity clear to you? |
4. |
Do you know the reason(s) why we are monitoring prices? If yes, please identify. |
5. |
Did the FAO counterpart provide adequate: |
a. |
a. Supplies (i.e. record book, pens, forms)? |
b. |
b. direction or guidance in performing your duties? |
If not, what other assistance or support do you think would have been necessary? | |
6. |
On what day of the week do you collect or record price information? Why? |
7. |
Were you able to make your report available to the data recorder or project staff on time each week? If not, why not? |
8. |
How do data collection or recording activities affect: |
a. your normal daily routines? | |
b. the selling of your products? | |
9. |
Three months from now, do you Still See yourself as a data collector or recorder for this system? Why? or Why not? |
10. |
What recommendations can you give to improve the System? |
Interviewer:__________________ |
Date:_____________________________________ |
B. INTERVIEW GUIDE FOR PARTICIPANTS (FARMERS)
Name: _____________________ |
Site:________________________________________ |
1. |
Do you know about the price bulletin board? |
(If answer is no, go to question 6.) | |
2. |
Do you know who collected this information? How was the information collected? |
3. |
Why is this price information system being established? |
4. |
Do you use it? If so, how often? |
If you do not use it, why not? | |
5. |
Is this price information useful to you? If so, how? (in what way?) |
6. |
Where else do you get price information aside from the bulletin board? |
7. |
What product did you sell last week? |
What was its price last week? | |
Do you know its price this week? | |
Do you know its price in of her markets? | |
What is the reason for the difference in prices? | |
8. |
Have your sales or profits increased as a result of the system? |
9. |
Is the price for the product(s) you sell also given on the radio? |
Do you find this price useful? In what way? | |
10. |
What additional market information (other than price) also might be useful? |
11. |
Do you have recommendations to improve the present system: |
· products monitored | |
· markets monitored | |
· information given or content | |
· dates or time of collection | |
· bulletin board location | |
· additional bulletin boards | |
· other suggestions | |
12. |
Would you like to participate in the collection or dissemination of market information? |
· as a data collector? | |
· as a record-keeper? | |
· to help post price and other information? |
Interviewer:________________________ |
Date:___________________________________ |
INTERVIEW GUIDE FOR REGIONAL STAFF
Name:______________________________ |
Assigned Market: __________________________________ |
1. |
a. What do you believe to be the impact of the MIS on local people |
b. If there are several impacts, which is (are) the most important? | |
2. |
Could the MIS exist without external support from FAO? DENR? |
3. |
a. Does the site where the MIS is located differ from other sites? |
b. In what ways? | |
4. |
a. How would you change the approach to creation of the system if you had to set it up? |
b. How would you adjust the system now? | |
c. Would you expand it? How? | |
5. |
a. Do you think an MIS could be Set up in the Baranguays where you work? |
b. How might it need to be adapted to suit those locations? | |
6. |
Would you be willing to help train and share your experiences with other field workers? |
7. |
Would you be interested in helping establish and manage an MIS? |
8. |
How would you describe your supervisor's attitude toward work with the MIS (very supportive, supportive, indifferent, somewhat negative, negative)? |
Interviewer:___________________________________ |
Date: ______________________________________ |
II. Uganda Question Guide for Semi-Structured Interviews
In the Uganda evaluation the following question guide was used to orient the discussion with MIS participants, the facilitator and observers.
What do you think the impact of MIS is on local participants? |
(improved earnings, business collaboration among small producers, awareness of marketing issues) |
If there is more than one impact, which is/are the most significant? |
How do you think the participants feel about the MIS? |
Could the MIS exist without external assistance from Makerere? FAO? |
(Could the system have been set up by the local people on their own? Can it now be sustained by them on their own?) |
If not, why not and what could be changed to help facilitate independent existence? |
Do you think communities will continue to operate the MIS after field testing has finished |
(Do you think they will change it, expand it?) |
What significant differences exist between the two field sites? How do these differences affect operations? |
If you could change the MIS establishment process, how would you do so? |
How would you change the field manual? |
* Available through the Community Forestry Unit, Forestry Policy and Planning Division, Forestry Department, FAO, Viale delle Terme de Caracalla, 00100 Rome, Italy.
** Available through the Sustainable Agriculture Program, IIED, 3 Endsleigh St, London WCIH ODD, United Kingdom.