Chapter 3: Gathering information in the field
Gathering information about the physical aspects of the territory
Gathering information about the use of resources
Gathering information about the management of resources
This chapter discusses techniques for getting information on tenure and natural resource management issues. It is divided into sections and each section is organized around a sample objective for a tenure study given in the textbox found on page 16, Chapter 2. Objective 1 was concerned with identifying the physical aspects of the territory so the first section talks about techniques that are particularly useful for gathering that information. The next two sections deal in turn with techniques that are useful for finding out how natural resources are used in the community (objective 2) and about the rules governing access to those resources (objective 3). Objective 4, which is a synthesis of the research process and deals with identifying tenure and management issues, is covered in Chapter 4 on the analysis of information.
For each technique there is a brief explanation of how it is used in the field. This is followed by a list of suggested questions that can he asked while using the tool. These questions are for illustrative purposes only and intend to give an idea of how each tool can illuminate tenure and resource management issues. They are not complete lists and neither do they mean to suggest that all the proposed questions should be looked at when a given tool is used. In most cases, the discussion of each tool ends with an example of how the technique was actually used in a recent RA. While the examples come mostly from work that has been done over the past several years in west Africa, these tools have been used in RAs all over the world. Experiences with the tools of RA suggest that they are very widely applicable.
While the chapter is organized into separate sections that follow the objectives defined above, it is important to note that in reality there is a lot of overlap in the information obtained using different research tools. That is, a map may be especially useful for gathering information about the physical environment, but it can also be used to discuss issues of resource use. For example, if an informant draws a pasture area on the map, one can follow up by asking who uses that pasture. A calendar may tell principally about resource use, but there are plenty of questions about management that can be asked as the calendar drawing progresses. For example, if an informant relates that women collect baobab fruits at a certain time of year, this is an opportunity to find out whether one has to have permission to gather these fruits. It is by asking questions about the same subjects using different tools and techniques that the researcher begins to triangulate or cross-check the information which has been gathered.
The order in which these tools are used is of no particular importance, though it will often make sense to roughly follow the order given in this chapter. This tends to follow a progression from simpler, more descriptive information of the physical and social environment to more complex and potentially more controversial information about management, tenure and conflict. Much of the order will depend on such factors as when people are available in the village and when the weather is appropriate for various activities. One might try to avoid walking a 10 kilometer transect in the middle of a blistering Sahelian afternoon.
The emphasis in this chapter is on using RA tools to gather information. However, it must be remembered that only about 60-70% of the time in the field is actually spent collecting information. The team should spend some part of every day in what is known as "team interaction." During this time the team looks over the information it has collected and begins to make note of important issues that are surfacing. From this, a "checklist" is prepared covering the issues that need to be addressed in the next round of activities. Each day, some subjects will be crossed off the checklist if enough information has been gathered on those topics and some other new subjects will he added. Once the team has decided what issues need to be addressed, it chooses the tools that will be most useful in getting the information and decides with whom it would like to carry out each activity.
The team interaction is also an opportunity to review methodological issues. The team needs to think about whether it is adequately triangulating information. Are the responses the same from different people using different tools and techniques or is there a need to verify some of the information? It is also important to review whether there are any biases creeping into the study. If so, deliberate actions can be taken to reduce the offending bias. If it appears that the team has been talking only to men, for example, this is the time to recognize the bias and to orient the next day's activities toward women. If the study has been relying principally on interviews, using some of the other techniques should be considered to illuminate different perspectives on the issues.
Gathering information about the physical aspects of the territory
For the somewhat exploratory tenure study proposed in Chapter 2, objective 1 is to identify the territory and the principal resources that are found there. Increasingly, projects are trying to orient their activities around the space that the village or villages define as their own (rather than using an outsider's definition of the relevant management unit). The village "territory" can be described as a land area which is habitually used by members of an agrarian community for their livelihoods, with boundaries that are recognized by members of the spatial unit and by those residing outside the territory (Painter 1991).
While this sounds relatively straightforward, there are numerous factors that can make the identification of territories very complex. In some places several villages may co-manage a single territory. In other cases, noble villages may feel that they control both their territory and the village of their captives or former captives. Sedentary cultivators may have a very different conception of territory from pastoralists. Nomadic or semi-nomadic peoples may recognize a territory that moves with them and have certain rules that they apply to resource management within the territory that they define. Even territorial boundaries as recognized by sedentary villages may not be static. Recognized limits may change according to the season. Or there may be one territorial limit that applies to control or access of land while another limit is applied to trees and yet another to pastures. An understanding of how villagers define their territory and the rules that apply to this space is critical for those attempting to address tenure and resource management issues.
The first objective also suggests the importance of identifying the various micro-ecological zones in the village territory. This is important because different micro-ecological zones often have different uses and may be characterized by different tenure arrangements. It is also important to have a sense of the kinds of resources that exist in the territory. As this information is gathered, it is useful to begin thinking about how the territory may be divided among several broad tenure "niches." Which part of the territory appears to be holdings (individual or household farming operations), which are commons (managed by a group), and which, if any, seem to be reserves (protected by the government)? 4
4 See Bruce (1989)
While the first objective is principally concerned with the physical characterization of the territory, as soon as questions of tenure begin to be addressed the issue arises of how the community manages the resources at its disposal. Tenure rules are among the principal mechanisms that communities use, first to define their territorial space and then to manage the resources within that territory. Objective 1 sets the stage for gathering more detailed information on such subjects as use patterns of resources found in the territory (objective 2) and the rules governing access to those resources (objective 3).
Two techniques are presented below: the participatory map (with several variations) and the transect.
In conventional mapping, the trained outsider draws a map of the village or territory. In participatory mapping, the informants are handed a stick 5 and asked to do the drawing. Outsiders who have not tried the participatory method are often surprised to find that illiterate people are quite capable of drawing illuminating maps. The primary concern is not with cartographic precision in drawing participatory maps. Instead it is with getting useful information that reveals local perceptions of boundaries, resource availability and distribution, etc.
5 For more on the importance of handing over the stick and letting local people guide the research process see the writings of Robert Chambers.
Mapping is usually quite simple. It is best done with a group (except for "holding" maps, discussed below, which may be done with an individual or several family members). A large open space should be found and the ground cleared. It is often useful to start with a map of the village (rather than the territory) since this is usually relatively non-controversial. It is easiest to start by placing a rock or leaf to represent a central and important landmark (such as the mosque, church or school). Informants are then asked to draw other things on the map that are important landmarks in the village. It can be suggested that they use stones, shells, leaves, etc. to mark significant places. They should not be interrupted unless they stop drawing, in which case questions can be asked such as whether there is anything else of importance that should be added. As the map is being drawn on the ground, it can be copied into the researcher's notebook for future reference. It is up to the researcher to decide how much detail is needed on this first village map. If it is to be used primarily as an ice-breaking exercise and a way to find one's way around the village, it may not be necessary to go into much detail. In such a case, most of the questions would be saved for the map of the territory.
In some cases it is possible to draw the map of the territory at the same time as the map of the village. When the central village has been sketched, the informants are simply asked to give an idea of the limit of the village's territory. If there is not enough room or time to do it on the same map, the exercise can be repeated later. This time the inhabited part of the village can be represented by a rock in the middle, and the rest of the territory can be sketched around it.
A third kind of map can be made of a single family's "holding." This type of map would show the different parcels farmed by the family, as well as, perhaps, the areas they use for pastures.
Useful historical information can also be obtained using the map as the basis for discussion. If there appear to be interesting changes to explore over time, additional maps can be drawn to show how, for example, the territory looked one or two generations ago. Alternatively, rather than actually doing another map, boundaries can be altered on the original map to show how they have changed over time.
| Some Questions to Ask while Doing
Maps TERRITORIAL MAP:
HOLDING OR FARM SKETCH MAP:
|
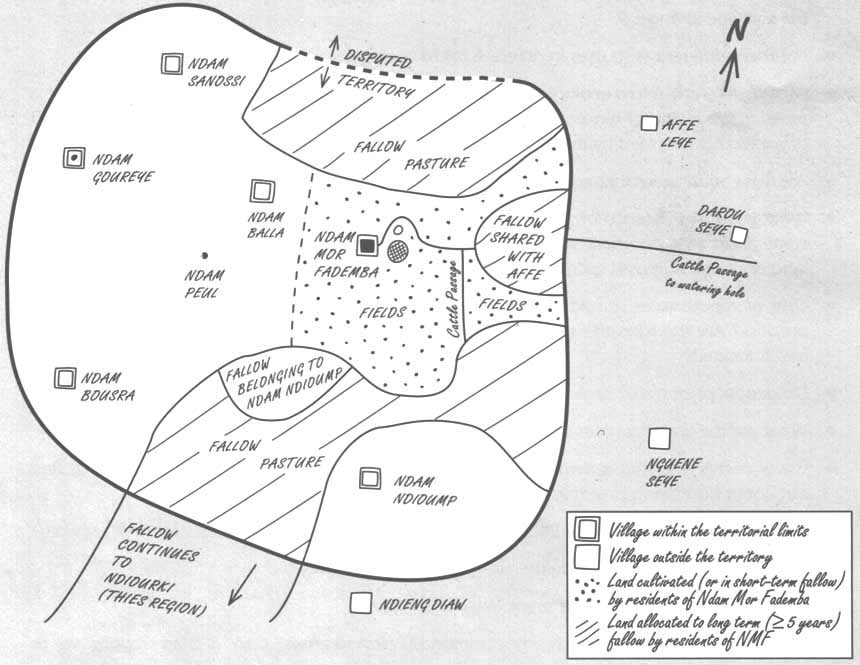
The map on the following page was done in a village in northern Senegal. The subject of the conflict with a neighboring village over the land to the north came up while drawing the map and was later pursued in numerous other discussions. The team found that Ndam Mor Fademba itself does not have a territory, but instead manages its land with five other Ndam villages. Thus the team began to explore the division of fields fallow. This was the first clue to a complex and evolving system of community management of fallow lands.
If a map is a bird's eye view of an area, a transect cuts across the same territory in order to get an idea of the diverse micro-ecological zones found in a territory. Depending on the size of the area to be covered and the nature of the terrain, a transect can be done on foot, animal, cart, or motor vehicle. Slower forms of transportation are preferable because they allow for greater observation. Using the map, or the advice of informants, a route is chosen that will travel across a variety of micro-ecological zones. If the territory has clear differences in elevation, it might be useful to cut a transect that traverses a range of elevations from the highest to the lowest parts of the territory.
Figure 2: Map of village territory
SOURCE: "Fields, Fallow, and Flexibility Natural Resource Management in Ndam Mor Fademba, Senegal"
If the territory is relatively flat, a path should be traced which will go through the widest variety of micro-ecological zones, including any forested areas, lowlands, upland fields, grasslands, etc. The researcher then proceeds with the informant or informants (on foot, by cart, etc.) to traverse the area. It is useful to try to go to the high point of the territory if there is one, or the spot from which there is the best view of a large area. It is often possible to see boundary markers, different land uses, etc. from such a height.
As the transect proceeds, questions relevant to the area being crossed should be asked, phenomena of interest observed, etc. One of the advantages of doing a transect is that often people are more willing to address sensitive issues (such as land ownership patterns or conflicts) when they are away from the village. If a question is related to the things being observed, it can seem less intrusive than if the same question is asked in a more formal interview situation. While everything is being noted as the transect proceeds, only later will the information be transcribed onto the kind of transect shown in Figure 3 (page 32). Some information in the transect may not be obtained in the first walk. As information is gathered from other activities, the diagram can be completed.
Some Questions to Ask while Doing a
Transect
|
While the classic transect is a direct traverse from one edge of the territory to the other, experience shows that certain adaptations can be practical. For example, if the team has six members it can be divided into three groups of two people each. Each group has one or two informants (ideally with a mix of men and women) and chooses a subject of particular interest. One group may focus on land use and cultivation, a second on land use and animals, and the third on tree and water resources. While the groups may follow similar paths for their transect, they may also deviate to look at things of particular interest to their subject. Afterwards, the three groups share information from their walks.
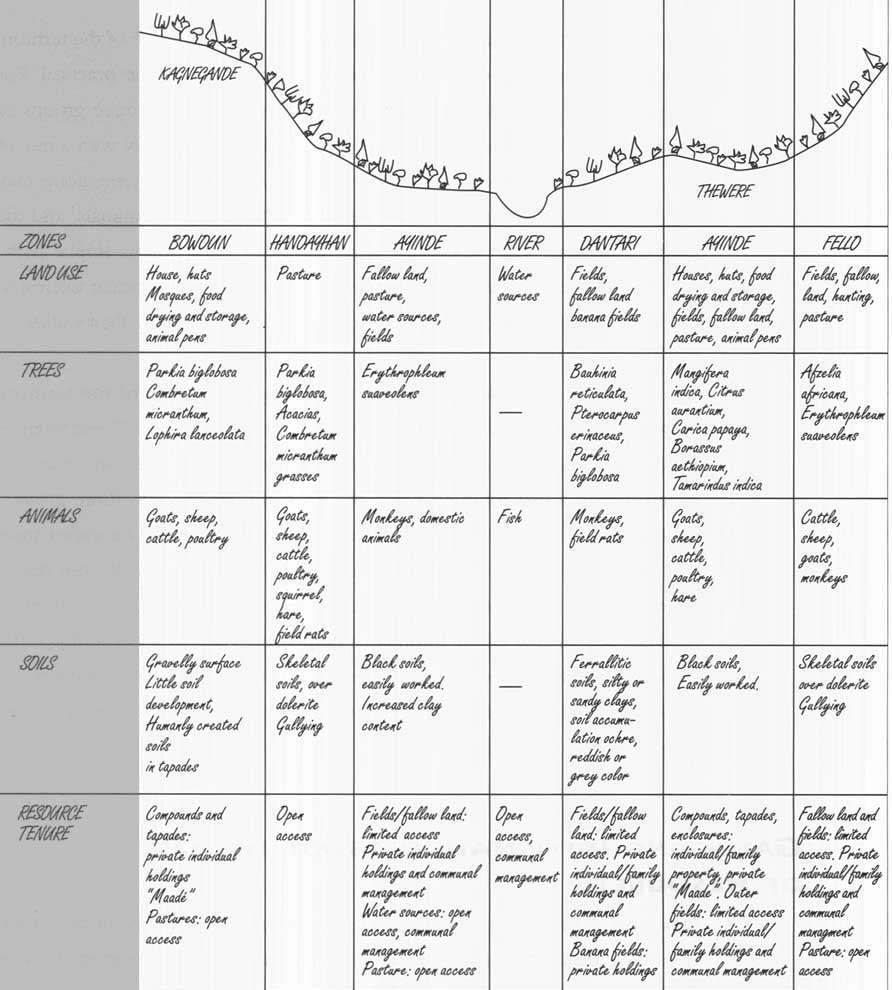
The transect shown on the following page was done of the territory between two study villages in the Fouta Djallon of Guinea. These villages have historic relations as nobles/captives. Some of the information was collected during a first morning when the RA team divided into three groups. Each group set off with an informant to gather information on either trees and water, land use, or animals and pastures. After the walk, the teams shared the information and then started organizing it on a big sheet of flipchart paper. One of the informants helped the team as it wrote down the transect by answering some more questions. When, as the study progressed, more relevant information was obtained (particularly concerning tenure relations), this was added to the transect.
Gathering information about the use of resources
Calendar
Matrix
Quantification
technique
Objective 2 of the tenure study in Chapter 2 is to identify how natural resources are used in the community. When information is gathered about resource use, the concern is with what kinds of resources are used (or not used), how and for what purpose they are used and who the users are. This information is important for understanding where there are constraints in resource use and for identifying resources that could be more fully or efficiently exploited. It begins to address equity issues: who has greater access to resources and who has limited use or is excluded altogether?
Source: Resource Management Practices and Tenure Constraints and Opportunities in the Kondou Watershed, Fouta Djallon, Guinea
In looking at these issues, it is important to be particularly sensitive to characteristics such as gender, ethnic group, social or economic standing and other factors that affect peoples' access to resources in the community in question. When use patterns are being studied, it is particularly important to pay attention to the more "marginal" or invisible users of resources. These are people who, because of their poverty or marginal social status, tend to be under-represented in discussions. Their use patterns may not be reported by others. Often, however, these same people are highly vulnerable and depend disproportionately on natural resource-based livelihood strategies. For example, they may engage heavily in the collection of wild tree products that require less cash investment than many other income generating activities.
Gathering information on the relative standing of community members. Before much sense can be made of this kind of information, it is necessary to have a basic understanding of the social structure of households and communities in the study area. If team members are not already familiar with the social structure before the start of the RA, it will probably be necessary to include this in the study of secondary materials before beginning the field study. Some information can be obtained from informal discussions during meals with the village host family. Other questions may require more systematic interviews. What is the farming unit? eating unit? Are families polygamous or monogamous? Are living arrangements by nuclear family or extended family? How are these defined? Are there castes in the community or other important social distinctions?
Wealth ranking. One extremely useful set of techniques for understanding wealth and other social characteristics of a community is called wealth ranking. This is a group of techniques that enables the researcher to gather information on the relative standing of members of the community (it avoids any questions about absolute levels of wealth). Wealth ranking is a broad subject and will not be addressed in detail here. There are many variations on the technique that have been used in various parts of the world, and it would be useful to consult the literature on the subject to identify the one that is most appropriate to the study being undertaken. 6
6 Experiences with a range of wealth ranking techniques can be found in RRA Notes, no. 15. IIED, London.
Briefly, one of the most commonly used wealth ranking techniques is social mapping. A social map is constructed using the physical map drawn by the village. The compounds are identified on the map and then the group drawing the map is asked to indicate the relative social status of families using different markers (such as beans, seeds or pebbles). Markers might be placed for such indicators as overall wealth (up to five beans or seeds to represent a wealthy family, one or two beans to represent those who are much less well off), status as a land borrower or land lender, whether the family has people working outside the village, etc.
Another frequently used wealth ranking technique is card ranking. First, the names of families in the village are placed on cards. A preliminary discussion takes place on the informant's perception of the meaning of "wealth." She or he is then asked to place the cards in piles so that each pile includes families with approximately equal wealth. This leads to a more complete discussion of wealth and its ramifications. Social mapping is generally done in public, while card ranking is more commonly done with an individual, in private. Which technique is more appropriate will depend on cultural factors and the setting in which people feel more comfortable discussing these issues.
In doing wealth ranking, discussions can easily move on to questions of whether people of different socio-economic strata have equal access to resources, use them at similar levels and for the same purposes, etc. Also, once the poorer people of the community have been identified, they can be expressly interviewed to ensure that their perspectives are included.
Three techniques are presented below that may be used to explore questions about how resources are used in a community: the calendar, the matrix and the quantification technique.
Calendars are tools that help to explore changes taking place over the period of a year. They can be useful in counteracting time biases because they are used to find out what happens in different seasons. Otherwise there is a tendency to discuss only what is happening at the moment the study is being done. Calendars can be used to study many things such as how much work people have at different times of year, or how their revenues change in different periods. These may be important for a project which needs to know when people have resources (time or money) to invest in project activities.
In many local tenure systems the rules governing access to resources change seasonally. For example, people may be permitted to collect products from trees in individual holdings during the dry season without asking permission. But they may be entirely excluded or have to ask the permission of the holder to harvest the same product during the cropping season. Some lands may be considered as individual holdings when they are under crops, and as village common property (for example, with open access for grazing) during the rest of the year. Calendars can help to focus discussions around these issues of seasonality.
It often helps to begin by discussing what people do when. When do they plant and harvest crops? When do they harvest different kinds of tree products? When do they keep their animals tied or fenced and when do the animals roam freely? Once these use patterns are established, questions can be asked about the rules and management practices that change by seasons.
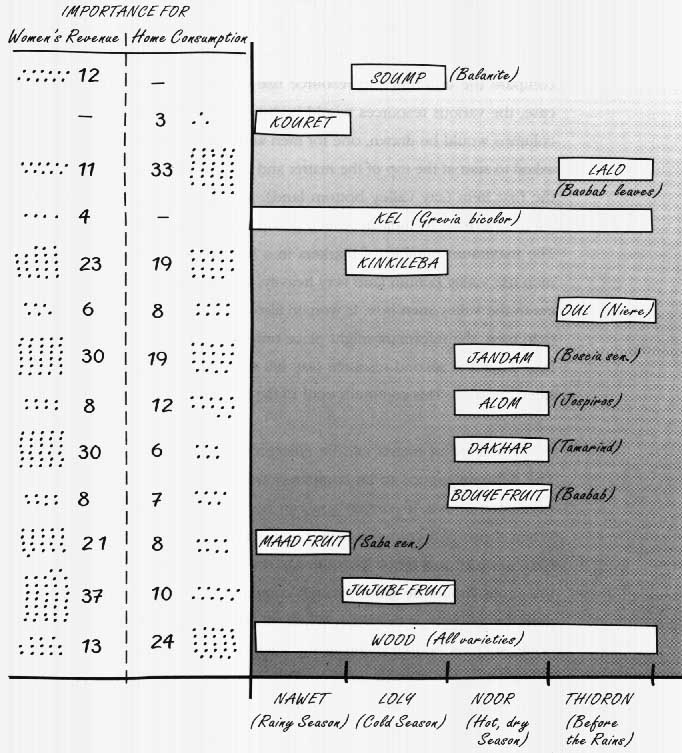
The example given in Figure 4 is a simple calendar of when people collect different products from trees. On the same diagram, one might indicate the crops cultivated. This would give an idea of how cultivation and collection activities complement one another in the local economy. Calendars can be drawn on a large paper laid out on the ground or can be traced in the sand or on a dirt floor. This activity is best done with a group so that people can help one another to remember things as the activity progresses. First, a scale is drawn along the bottom with the months or seasons. How to define the time scale will depend on the periods that are known and used by local informants. In some cases people have local names for the months, in others they use religious calendars. Some people are more familiar with seasons than months. The scale to one that makes the most sense to the informants.
A logical moment should be chosen to begin the sequence (the rainy season or the first month of the calendar year, for example). People can be asked to think of all the products they collect from trees during the period in question. These are then marked on the calendar. When using markers and paper, different colors may be used to show whether the product is collected by men, women, or children. Other symbols can be drawn to indicate other useful information such as whether the product is sold, used at home, or some of each. When all the products collected in one time period have been noted, the next time period is examined and the various products for that period filled in.
The calendar on the following page was drawn in a village in the peanut basin of Senegal. The RA was quite surprised to find that even in this area, which has been subject to severe desertification, the population still places considerable emphasis on tree product collection. The team later asked the villagers to use quantification techniques (see page 41) to rank the importance in the household economy of the products they collected. In this case, the number of markers shows the relative importance of each crop for home consumption and for women's revenue.
Some Questions to Ask while Drawing
a Calendar
|
Figure 4 Tree products collection calendar
NOTE: dots represent markers such as beans or pebbles. The number of markers reflects the degree of importance i.e. more markers = greater importance.
SOURCE: Le foncier et la gestion des ressources naturelles: une étude de cas employant la méthode MARP
The matrix is a powerful technique that can be adapted to many different kinds of information needs. Two types of matrices that are especially useful for gathering information on resource management are classification matrices and historical matrices.
The Classification (or ranking) matrix is used to get information about the importance or the frequency of a certain event. For example, one might try to find out who uses the various resources found in the community by drawing a resource-use matrix. A simple matrix of this type might only compare the difference in resource use between men and women. In this case, the various resources would be listed along the vertical axis. Then two columns would be drawn, one for men and one for women. The informant is asked to start at the top of the matrix and compare men's and women's use of the first item (say valley bottom land). Markers (beans, seeds or pebbles) should be used to indicate which group uses the resource most intensively. The maximum number of markers in a box might be limited to 10. If, say, men use valley bottom land very heavily, the informant would place 10 markers in the valley/men box. If women also use that land, but considerably less than men, the informant might place only four markers in the valley/women box. Then the second resource (say hill slope lands) is discussed, asking the same question. This continues until all the boxes have been filled in.
This kind of matrix can be enlarged to make a series of comparisons. The different groups to be compared are placed on the horizontal axis. As suggested above, a comparison can be made between men and women. When those two columns have been completed, a second comparison of rich people and poor people can be carried out. The whole list of resources should be gone through comparing whether the resource is used more by the rich or the poor. When this is finished, a third category can be done, such as people living in the village versus people from neighboring villages and people who are complete strangers. Matrices can be drawn on paper or on the ground. It is usually best done in a group since the discussion, as people try to agree on how many markers to place, is often highly illuminating.
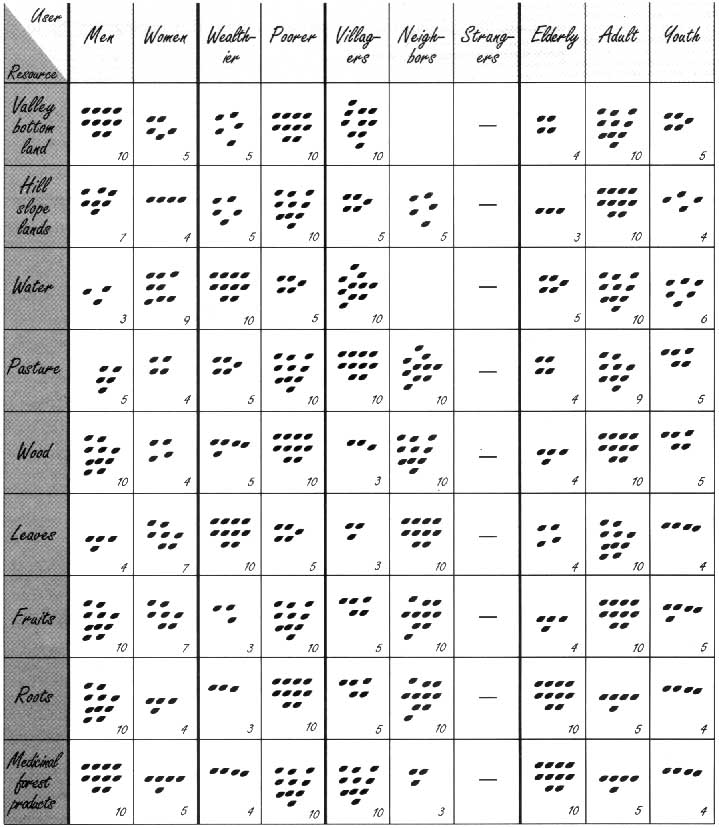
The matrix on the following page was done in a village in Guinea. The RA team was divided in two groups and half did the matrix with men and the other half did the same matrix with women. The dots represent markers that were placed by informants to show whether, for example, men or women used a given resource more. It was very important to be clear on the words used to explain the translation. It was necessary to specify whether the question referred to who exploits the resource or who gets the benefits. For example, a poor person may be the one who actually chops the wood, but he may give or sell it to his master.
Figure 5: Classification matrix
NOTE: dots represent markers such as seeds. The number of markers reflects the degree of use, i.e. more seeds = more intense use.
SOURCE: Resource Management Practices and Tenure Constraints and Opportunities in the Koundou Watershed, Fouta Djallon, Guinea.
The Historical matrix looks at how various factors have changed over time. Such a historical perspective is extremely important in studying resource use issues. Projects often err as a result of treating resource management as a static phenomenon. Many fail to see how local strategies evolve with time in response to changing conditions. They therefore fail to build the same kind of flexibility into their actions and may (without recognizing the consequences) undertake actions that impinge on the local population's capacity to adapt.
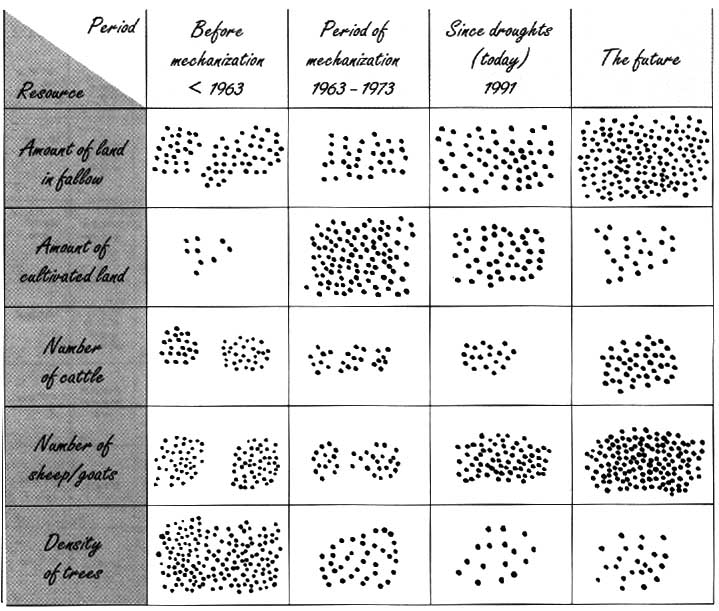
Historical matrices can help to break away from static analyses of resource management and use. As shown in Figure 6. different time periods appear in chronological order on the horizontal axis beginning with the earliest time period. A discussion with the informants will help to identify events which may have caused significant changes in resource endowments or use. Different resources are put on the vertical axis. This matrix is best completed vertically so that people do not have to keep jumping back and forth in time. They should be asked to think first about the earliest time period in their matrix (the first column). At that time, would they say that there was a lot of land in fallow? If so, they will put many markers in the box. The informants are then asked about the amount of cultivated land, the number of cattle, the number or density of trees, etc. When the first column has been completed, the next is begun. The informants are asked, "during the period of mechanization (or whatever the second period is in the matrix) was there more or less land in fallow than during the first period?" Continuing down the column, the informants are asked to place markers to show how resources have changed.
NOTE: dots represent markers such as beans or pebbles The markers reflect availability of resources, i e more dots = greater availability
SOURCE: Fields, Fallow, and Flexibility Natural Resource Management in Ndam Mor Fademba, Senegal
The matrix shown here was done by villagers in northern Senegal. The dots represent markers that were placed by informants to show how the availability of various resources changed over time. Thus, for example, much land was in fallow before the period of mechanization. During the 1960s, however, the amount of fallow land decreased and the amount of land under cultivation increased commensurately. After completing the first three columns, the three older men who were doing the matrix were asked to speculate on how they thought resource use would evolve in the future.
In doing matrices, markers such as beans are used to indicate the ranking of different variables. It is often useful to use markers as ranking tools in simpler comparisons as well. If the researcher carries along a bag of pebbles or beans, it is easy to ask informants to make quantitative estimates whenever it would be useful for the study. For example, it may be interesting to know whether the borrowing of land is a common practice. One way to find out is to place a pile of markers in front of the informant who is then told that the markers represent the total number of farmers in the village. The informant is asked to divide the markers into two piles to show how many people are borrowers of lands and how many do not borrow. Question can then be asked about people out, side the village who borrow land in the village Awl people in tile village who borrow land outside are the borrowers men or women? (The informant can be asked to divide tilt' borrower category into a pile for men and a pile for women). On another question markers might be used to find out what proportion of the population owns cattle or sheep and goats.
| Some Subjects to Discuss while
Doing Matrices Matrices can be used to explore almost any subject. They are especially useful for provoking discussions. What is important is to think very carefully about what variables to put on each axis to make CLASSIFICATION sure that they are relevant, consistent and easily understood. Also, it is important to consider whether it makes more sense to rank horizontally or vertically. In some cases it will affect the kind of information obtained, while in others, one way is more logical than the other in facilitating a comparison. The following offer some examples of the variety of ways matrices may be used to gather information on resource use. CLASSIFICATION MATRICES:
HISTORICAL MATRICES:
|
Some Questions to Ask while Using
Bean Quantification
|
The information obtained will be very approximate, but it will often be sufficient for the needs of a project. Using these techniques is much faster than conducting a more detailed survey. In addition, collecting approximate information using marker quantification may be less threatening than collecting more detailed information with a formal survey. Informants would thus be less likely to provide purposefully misleading answers. The results obtained from these qualitative methods may in some cases he more accurate than precise (but wrong) quantitative results.
Gathering information about the management of resources
Objective 3 in the tenure study is to identify who makes decisions about resource use, what rules apply and who plays a role in negotiating any disputes that may arise. In looking at questions about who makes decisions concerning resource use, it is important to remember that there are many different levels of decision making. Many important decisions concerning resource use are made entirely informally and by individuals. Others arc made at the family level where one or more people may have a particular influence on other members of the family. Decisions may also be made formally, either by committees or by powerful individuals with clearly designated roles in the community.
While there is a tendency to focus on formal mechanism for decision-making, it is important not to omit the role of individuals and families. The role of women, in particular, is often noted at this level even when they arc largely absent from more formal decision-making structures. For example there may be rules in a community about which trees can he cut for fire Women who actually cut the wood may (or may not) follow the-se rules. In addition, they may have practices, such as certain ways of pruning the trees to encourage regeneration, that are not codified but are very important to resource management.
Rules concerning resource management are also made at different levels. Part of the work of the RA is to understand how many different kinds of rules have an effect on the community in question. Are there government rules that apply in theory? Do these rules have an influence in practice? Are there also local rules that come into play? How do these two sets of rules interact? Then, there is the question of what actually happens, which may be very different from both local rules and formal legislation. The latin phrases de jure and de facto are sometimes used to describe situations where the reality differs from what is supposed to exist according to the formal rules. De jure is, simply, fin law," or what is supposed to take place if everything went by the rules. De facto is in fact," or what really does happen.
Because RA often takes the village as its unit of observation, there is a danger of seeing the community as a self-contained entity and failing to sec the ways in which it is influenced by the larger world around it. It is highly unlikely that a community's management of resources could avoid being affected in some way by rules and authorities outside. In some cases, the effect may be that people adapt their behavior to conform to the rules. In other cases communities may resist rules from the outside and seek to implement their own strategies. In both instances, the outside world has its effect and these kinds of linkages should be identified in the study. This may require a certain amount of research outside the village, which might include consulting written sources to find out what official rules exist, or interviewing government authorities.
Different tenure regimes are often found in different micro-ecolcygical zones with different resource use patterns. This is why it is so important to gather information identifying resources and their use as discussed in the preceding sections. The tenure regime for the area that is privately managed by an individual household is sometimes called the "holding." This contrasts with the "commons," which refers to property which is managed by the community. A third kind of tenure rule may apply to "state reserves" whose use is regulated by the state. In each case, different rules will apply concerning who has rights to use resources and who has rights to exclude others from using them. 7
7 These issues are taken up in much greater detail in Bruce (1989)
Conflicts over resource use are often very revealing of the kind of issues communities face in managing their resources. They also illuminate the mechanisms that exist to deal with problems when they arise. Studying such conflictual situations can provide examples of how rules in the community really work instead of how they function in some idealized representation. However, these topics may be very sensitive and they must be broached with particular care.
The purpose, then, of this part of the research is to understand what management practices (both informal and formal) and rules of access and exclusion apply to each of the resources or tenure niches which have been identified in the territory.
All of the techniques described until now can he used to get information on these tenure questions. In fact, it is often easier to get at these questions in the course of a variety of different activities rather than trying to do a whole interview focused on tenure rules. A few questions might be asked about tenure on fields and pastures as these areas are traversed during a transect walk. Some other questions might be asked about tree tenure during the preparation of a calendar of tree product collection activities. Other questions will certainly arise during mapping exercises and matrix drawing.
Three techniques are presented here that are useful for understanding resource management questions: the Venn diagram, the conflict matrix (which is a variation on the matrices presented above) and the semi-structured interview.